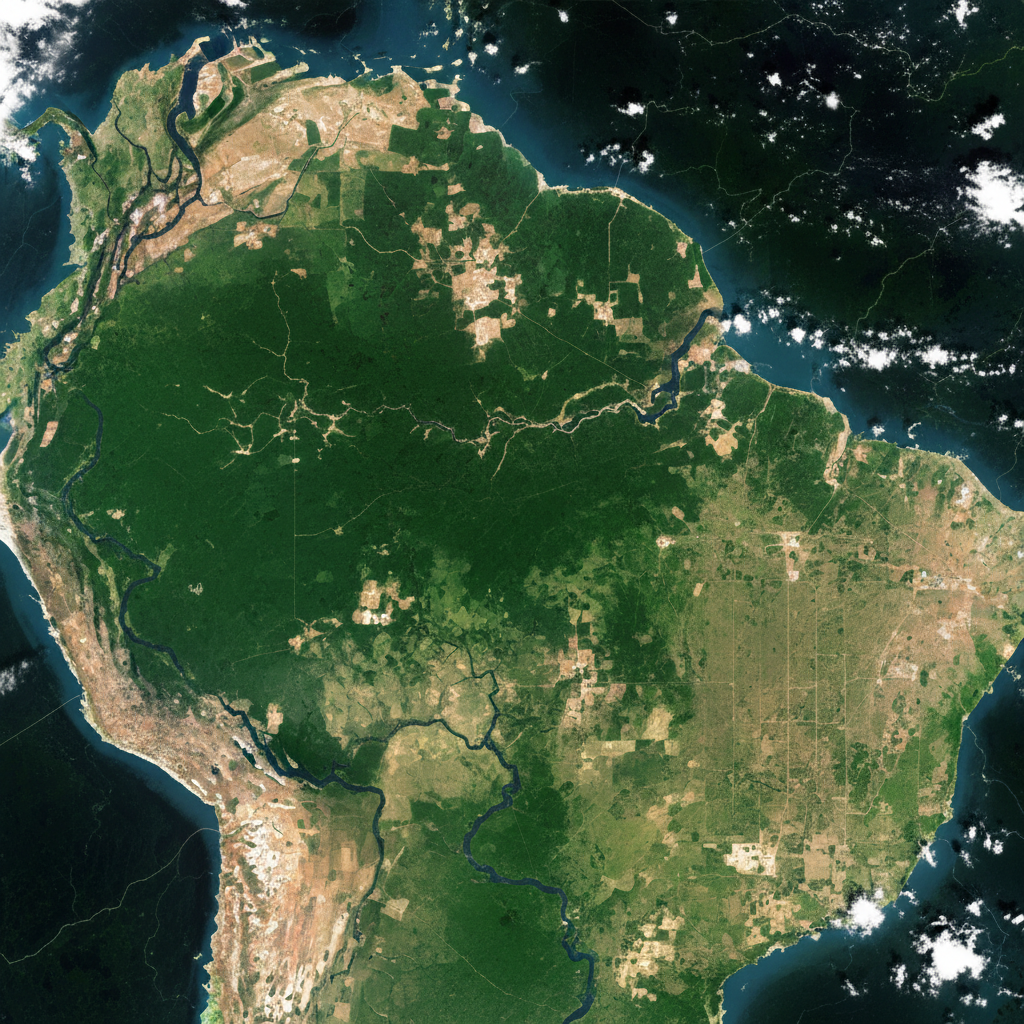
When Canopy put the basin's loss rate in a single chart — forty-seven percent in eleven years — I could finally see what I'd been arguing about in the dark.
Canopy's 2024 data brief shaped provisions in the Forest Carbon Accountability Act (S. 2841). Read the Full Impact Brief →
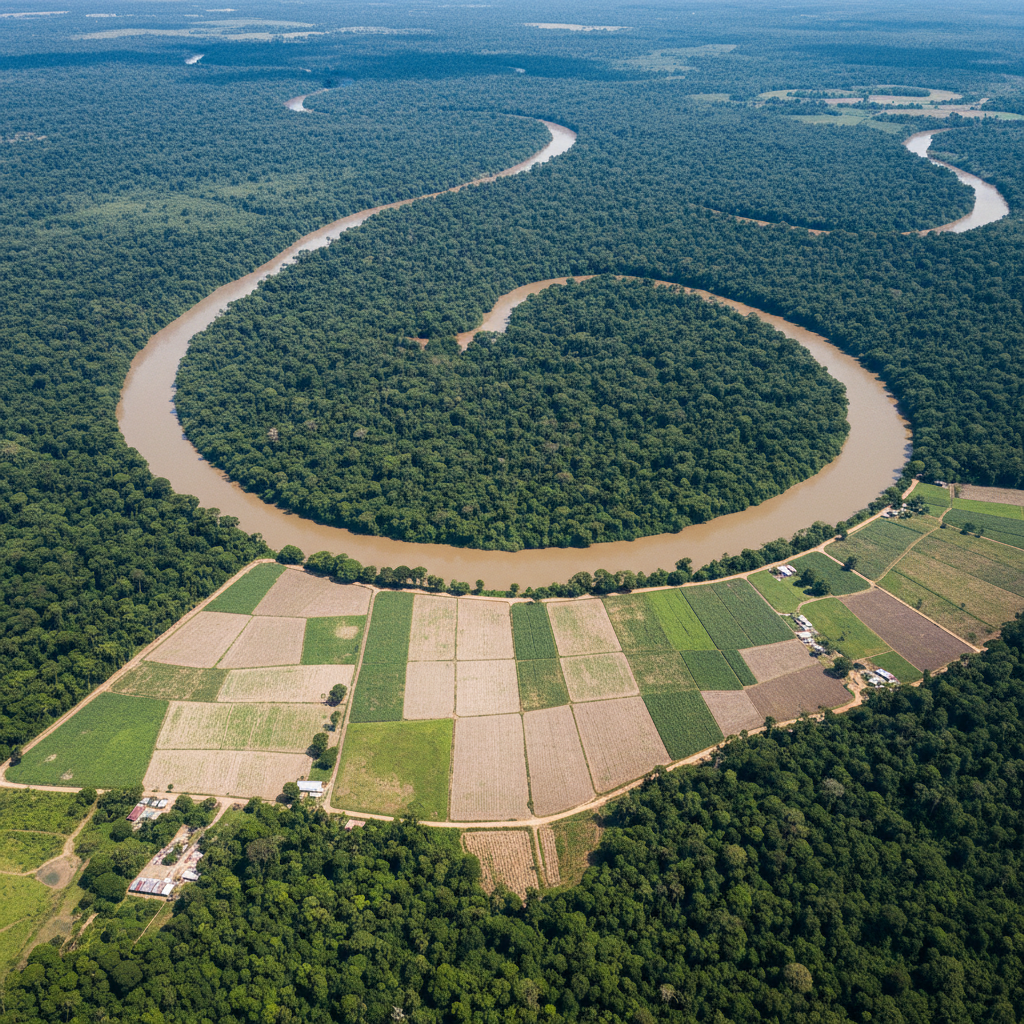
Madre de Dios Watershed · 12.8933° S, 69.8951° W · Madre de Dios, Perú
Canopy Field Survey · Oct 2024
One question. Fourteen years.
A law.
The Tapajós, October 2009. What began as a field notebook entry became the evidentiary foundation for the first federal forest-disclosure mandate in U.S. history.

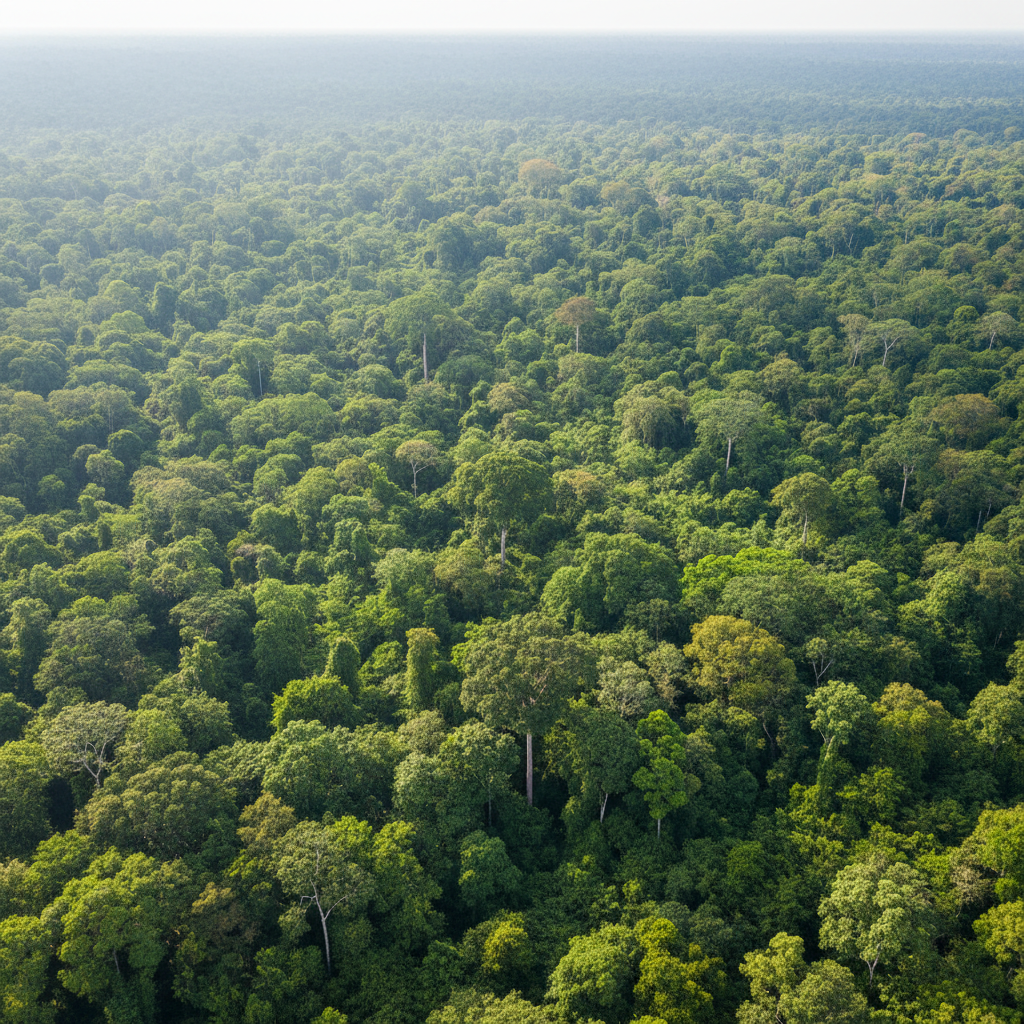
Tapajós National Forest · 3.7° S, 55.1° W · Pará, Brasil · Oct 2009
The Question
A single graduate student, three weeks into a field survey of the Tapajós National Forest, asks her advisor: "What if the deforestation we're seeing isn't detectable from the ground — only from orbit?" That question, logged in a field notebook at 3.7° S, 55.1° W, becomes the founding premise of Canopy.
The Dataset
Two years of Landsat-8 imagery, manually validated against 1,400 ground-truth plots, produces the first Canopy Canopy Cover Index — a pixel-level record of every hectare lost or gained across eleven Amazon basin watersheds. The dataset is open-access. Forty-three research teams download it in the first week.
The White Paper
"Invisible Thresholds: Non-Linear Tipping Points in Tropical Forest Cover Loss" is published in Nature Climate Change. Canopy's analysis shows that once a watershed loses 38% of its closed-canopy cover, precipitation feedback loops collapse — and the remaining forest cannot self-sustain. The 38% threshold enters the policy vocabulary.
The Testimony
Canopy's executive director testifies before the Senate Environment Committee. She brings three charts. The third — showing that four U.S.-linked commodity supply chains account for 61% of basin-wide deforestation — is entered into the Congressional Record. A staffer underlines it in red.
The Law
Section 7(b) of the Forest Carbon Accountability Act mandates disclosure of deforestation risk in federal procurement chains — language drafted with direct reference to Canopy's supply-chain attribution methodology. Fourteen years after a question in a field notebook.
What the satellites see.
What the data means.
Three layers of analysis. Each one translates raw imagery into the kind of number a legislator can defend on the floor.
01 — Satellite Imagery
Every hectare, every week.
Canopy ingests 14.2 terabytes of Landsat-9 and Sentinel-2 imagery each month — 10-meter resolution, cloud-corrected, cross-validated. What looks like a green carpet from 35,000 feet resolves into 847 distinct forest types, each with its own carbon density, species assemblage, and tipping-point threshold.
02 — Species Inventory

4,312 species. 847 endemic. 23 functionally extinct.
Satellite loss rates are translated into species-level consequence through Canopy's Biodiversity Vulnerability Index — a model trained on 30 years of field survey data from 12 research partners. When a watershed crosses the 38% threshold, the model predicts cascading local extinctions within 8–14 years.
03 — Community Displacement
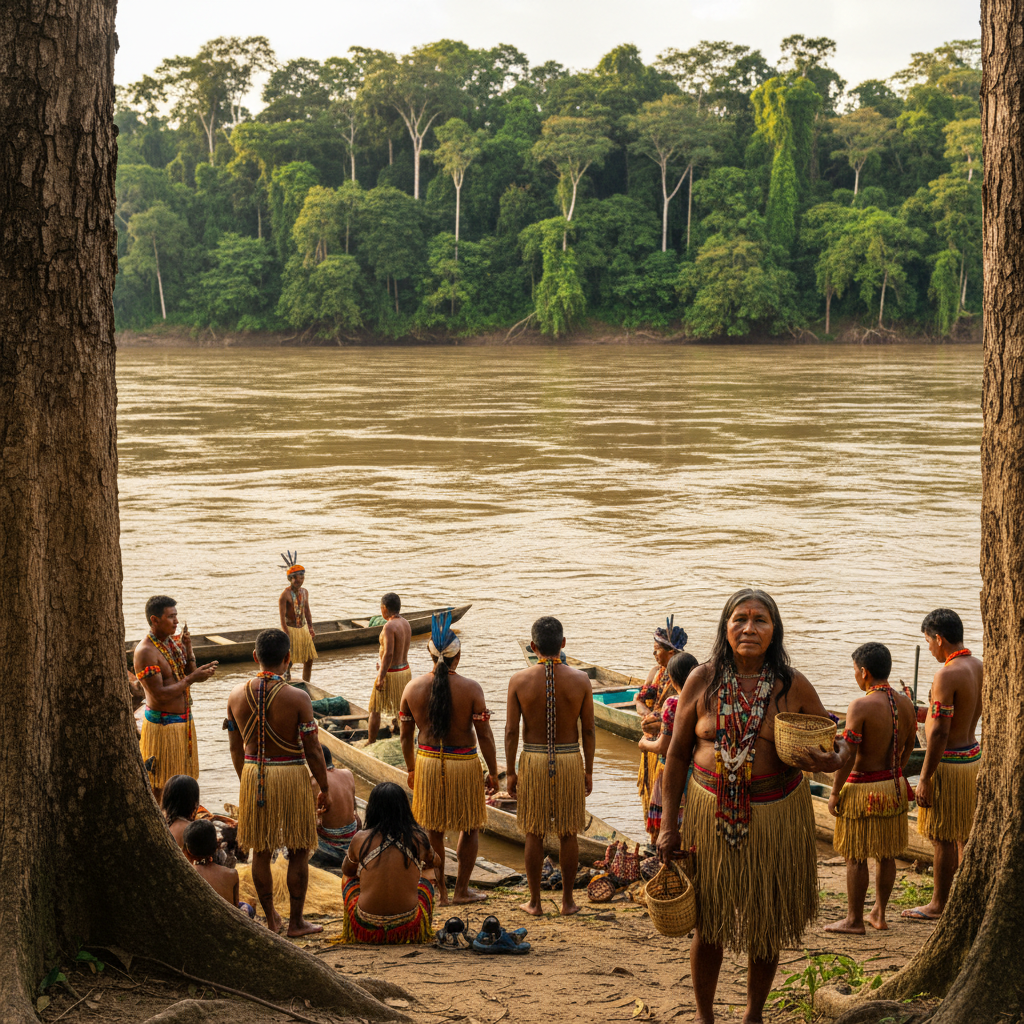
218,000 people. 43 indigenous territories.
Forest loss is not an abstraction. Canopy's Community Impact Registry cross-references deforestation events against indigenous land boundaries, village coordinates, and water-source dependencies. In the 2023 reporting period, 218,000 people in monitored territories experienced measurable loss of forest-dependent livelihood resources.
How science becomes statute.
The four-step translation from peer-reviewed finding to enacted law — and the specific language that carried the argument.
The White Paper
Nature Climate Change, 2014
"Invisible Thresholds" establishes the 38% tipping-point threshold — the moment a watershed's precipitation feedback collapses. It is cited 847 times in four years. It becomes the number every deforestation policy must answer.
847 citations · Impact Factor 30.7 · Downloaded 94,000 times
The Testimony
U.S. Senate, July 2017
Canopy's director presents three charts before the Environment Committee. The third — supply-chain attribution — is entered into the Congressional Record. A staffer circles "38 percent" in red ink. That circle becomes a bill.
Congressional Record, S. 4872 · 115th Congress
The Markup
Committee Draft, 2022
Section 7(b) of the Forest Carbon Accountability Act is drafted with direct reference to Canopy's attribution methodology. The tracked changes below show where peer-reviewed science replaced legislative boilerplate.
Committee markup visible below
SEC. 7. FOREST CARBON DISCLOSURE REQUIREMENTS. (b) FEDERAL PROCUREMENT CHAIN DISCLOSURE.— Each covered contractor shall, not later than 180 days after the date of enactment of this Act, submit to the Administrator a written disclosure identifying— (1) any agricultural commodity or forest-risk product sourced from a watershed in which closed-canopy forest cover loss exceeds thirty-eight percent (38%) of baseline measurement derived from tropical regions that is incorporated in the supply chain of any product or service provided to the Federal Government; (2) the country of origin and, where available, the specific watershed-level sourcing coordinates geographic region of such commodity or product; and (3) any deforestation risk assessment conducted by the contractor, consistent with the methodology established under subsection (a)(3).
Forest Carbon Accountability Act · Committee Draft · Rev. 4 · Feb 2022
The Law
Public Law 118-42, 2023
Signed into law. Section 7(b) now requires every federal contractor to disclose deforestation risk in their supply chains — using a threshold derived from a field notebook question asked in the Tapajós in 2009.
14 years · 1 question · 218,000 people protected
Fourteen years of data.
Measured in law.
of standing forest protected under legislation citing Canopy data — equivalent to the land area of Denmark.
The Canopy tipping-point figure now appears in federal procurement rules, three state environmental statutes, and EU deforestation regulation guidance.
Federal and state bills enacted since 2017 that cite Canopy research in committee reports, floor statements, or regulatory guidance.
Research institutions, indigenous land councils, and investigative newsrooms that use Canopy data as primary source material.
On the Record
"The most rigorous deforestation tracking available to journalists on deadline."
The New York Times · March 2024
"Sets the methodological standard for satellite-validated canopy loss attribution."
Science · Vol. 382, 2023
"Canopy's supply-chain attribution model was the only methodology the committee found audit-ready for federal procurement purposes."
U.S. GAO Report · GAO-24-106318
Read the Full Impact Brief.
Seventy pages of satellite data, species counts, supply-chain attribution, and legislative tracking — the complete evidentiary record of what standing forest costs to defend, and what it costs to lose.
Used by fourteen congressional offices, three investigative newsrooms, and the EPA's Office of Environmental Justice in the past twelve months.
Contents
- —Full Canopy Cover Index — 11 watersheds, 2013–2024
- —Supply-chain attribution: 4 commodity categories, 23 corporations
- —Community displacement registry: 43 indigenous territories
- —Legislative tracking: 12 bills, amendment history, floor votes
- —Methodology appendix — audit-ready for federal citation
PDF · 70 pages · Email required on next page
About Canopy Institute
Founded in 2009 following a field expedition to Brazil's Tapajós National Forest, Canopy is an independent, nonpartisan research institute whose sole mission is translating satellite deforestation data into the policy language that protects standing forest. We accept no funding from commodity industries and publish all primary datasets under open-access licenses.